Adler outlier detection
This notebook demonstrates some of the functions provide by Adler to assist with simple outlier detection
[1]:
from adler.objectdata.AdlerPlanetoid import AdlerPlanetoid
from adler.science.PhaseCurve import PhaseCurve
from adler.objectdata.AdlerData import AdlerData
import adler.utilities.science_utilities as utils

import numpy as np
import pandas as pd
import matplotlib.pyplot as plt
import matplotlib.gridspec as gridspec
import astropy.units as u
[2]:
# ssObjectId of object to analyse
ssoid = "8268570668335894776"

# load object from local database
fname = "../../notebooks/gen_test_data/adler_demo_testing_database.db"
planetoid = AdlerPlanetoid.construct_from_SQL(ssoid, sql_filename=fname)

# retrieve observations in the r filter
obs_r = planetoid.observations_in_filter("r")
No observations found in u filter for this object. Skipping this filter.
No observations found in y filter for this object. Skipping this filter.
n unpopulated in MPCORB table for this object. Storing NaN instead.
uncertaintyParameter unpopulated in MPCORB table for this object. Storing NaN instead.
[3]:
# define the phase curve model using the SSObject data

sso_r = planetoid.SSObject_in_filter("r")
r_H = sso_r.H
r_G12 = sso_r.G12

pc = PhaseCurve(H=r_H * u.mag, phase_parameter_1=r_G12, model_name="HG12_Pen16")
/home/docs/checkouts/readthedocs.org/user_builds/adler/envs/latest/lib/python3.10/site-packages/sbpy/photometry/iau.py:53: InvalidPhaseFunctionWarning: G12 parameter could result in an invalid phsae function
  warnings.warn(msg, exception)
[4]:
# calculate data minus model residuals
res = obs_r.reduced_mag - pc.ReducedMag(obs_r.phaseAngle * u.degree).value
[5]:
res
[5]:
array([ 0.32766394,  0.15295882,  0.25896465,  0.18974566, -0.09082071,
       -0.03174331, -0.03881347,  0.04204286, -0.24224314, -0.17745899,
       -0.00492505, -0.0862188 , -0.14134951, -0.2535722 , -0.07715194,
       -0.10041373, -0.24621894, -0.02628162, -0.04041881,  0.09704904,
       -0.31718808, -0.06039929, -0.04072827, -0.07548697, -0.15773742,
       -0.18076436, -0.11133244, -0.19906023, -0.06507692,  0.19938055,
        1.97134538,  1.79108103,  1.91881725,  0.20952169,  0.57060468,
       -0.12014891,  0.15038993,  0.63377464])
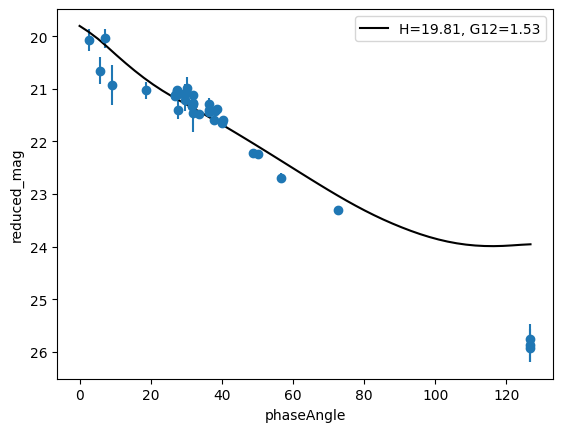
[6]:
# plot the observations with the SSObject phase curve
x_plot = "phaseAngle"
y_plot = "reduced_mag"

x = getattr(obs_r, x_plot)
y = getattr(obs_r, y_plot)
yerr = obs_r.magErr

fig = plt.figure()
gs = gridspec.GridSpec(1, 1)
ax1 = plt.subplot(gs[0, 0])

ax1.errorbar(x, y, yerr, fmt="o")

# plot the phase curve model
alpha = np.linspace(0, np.amax(obs_r.phaseAngle)) * u.deg
red_mag = pc.ReducedMag(alpha)

# legend label for the phase curve model
pc_label = []
for x in pc.model_function.param_names:
    pc_label.append("{}={:.2f}".format(x, getattr(pc.model_function, x).value))
pc_label = ", ".join(pc_label)

ax1.plot(alpha.value, red_mag.value, c="k", label=pc_label)

ax1.invert_yaxis()
ax1.set_xlabel(x_plot)
ax1.set_ylabel(y_plot)
ax1.legend()

plt.show()
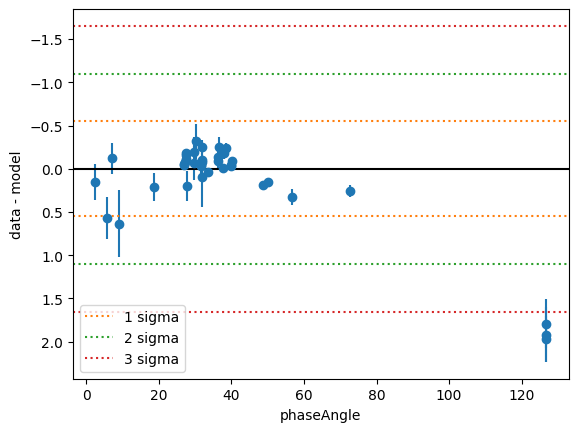
[7]:
# plot the data - model residuals
x_plot = "phaseAngle"

x = getattr(obs_r, x_plot)
yerr = obs_r.magErr

fig = plt.figure()
gs = gridspec.GridSpec(1, 1)
ax1 = plt.subplot(gs[0, 0])

ax1.errorbar(x, res, yerr, fmt="o")

ax1.axhline(0, c="k")

# indicate the standard deviations of the residuals
res_std = np.std(res)
for i in range(1, 4):
    ax1.axhline(res_std * i, ls=":", c="C{}".format(i), label="{} sigma".format(i))
    ax1.axhline(-res_std * i, ls=":", c="C{}".format(i))

ax1.invert_yaxis()
ax1.set_xlabel(x_plot)
ax1.set_ylabel("data - model")
ax1.legend()

plt.show()
Return a list of flags for outlying objects.
The Adler utils.sigma_clip function is a wrapper for astropy.stats.sigma_clip. We do this in order to return just the clip mask, and also to make it easier to call a “zero” central function.
[8]:
# astropy sigma_clip normally uses the median as the central function
utils.sigma_clip(res, cenfunc="median", maxiters=1)
[8]:
array([False, False, False, False, False, False, False, False, False,
       False, False, False, False, False, False, False, False, False,
       False, False, False, False, False, False, False, False, False,
       False, False, False,  True,  True,  True, False, False, False,
       False, False])
[9]:
# assuming that the model is the ground truth, we use zero as the centroid for the residuals
utils.sigma_clip(res, cenfunc=utils.zero_func, maxiters=1)
[9]:
array([False, False, False, False, False, False, False, False, False,
       False, False, False, False, False, False, False, False, False,
       False, False, False, False, False, False, False, False, False,
       False, False, False,  True,  True,  True, False, False, False,
       False, False])
[10]:
# use the standard deviation of the residuals to identify outliers
utils.outlier_std(res, res, std_cut=3.0)
[10]:
array([False, False, False, False, False, False, False, False, False,
       False, False, False, False, False, False, False, False, False,
       False, False, False, False, False, False, False, False, False,
       False, False, False,  True,  True,  True, False, False, False,
       False, False])
[11]:
# use a simple threshold value for residuals to find outliers
utils.outlier_diff(res, diff_cut=1.0)
[11]:
array([False, False, False, False, False, False, False, False, False,
       False, False, False, False, False, False, False, False, False,
       False, False, False, False, False, False, False, False, False,
       False, False, False,  True,  True,  True, False, False, False,
       False, False])
[12]:
# consider the residual compared to the uncertainty of the measurement
std_err = 5
utils.outlier_sigma_diff(res, yerr, std_err)
[12]:
array([False, False, False, False, False, False, False, False, False,
       False, False, False, False, False, False, False, False, False,
       False, False, False, False, False, False, False, False, False,
       False, False, False,  True,  True,  True, False, False, False,
       False, False])
[13]:
# plot the data - model residuals
x_plot = "phaseAngle"

x = getattr(obs_r, x_plot)
yerr = obs_r.magErr

fig = plt.figure()
gs = gridspec.GridSpec(1, 1)
ax1 = plt.subplot(gs[0, 0])

ax1.errorbar(x, res, yerr, fmt="o")

ax1.axhline(0, c="k")

# indicate the standard deviations of the residuals
res_std = np.std(res)
for i in range(1, 4):
    ax1.axhline(res_std * i, ls=":", c="C{}".format(i), label="{} sigma".format(i))
    ax1.axhline(-res_std * i, ls=":", c="C{}".format(i))

mask = utils.outlier_sigma_diff(res, yerr, std_err)
ax1.scatter(x[mask], res[mask], edgecolor="r", facecolor="none", marker="o", zorder=3)

ax1.invert_yaxis()
ax1.set_xlabel(x_plot)
ax1.set_ylabel("data - model")
ax1.legend()

plt.show()
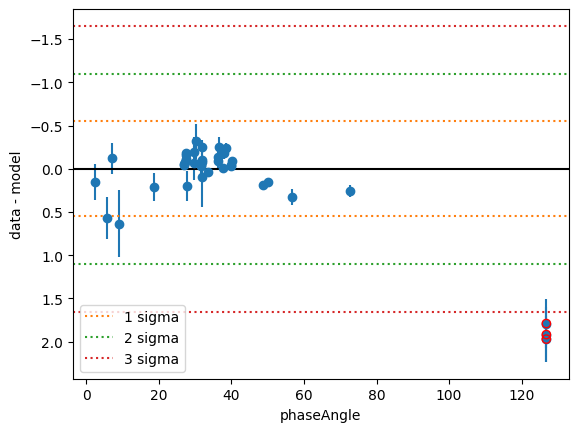
NB that for phase curve models, residuals can be much larger than the photometric uncertainty!
[ ]: